
Transforming Press Machine Operations with SDM
Common Problems in Press Machine Operations
Pressing and stamping machines drive high-volume metal forming (e.g. automotive body panels), but they are prone to mechanical and alignment faults. Off-center loading (uneven force in the die) causes the press ram to tilt, leading to accelerated die wear and part defects.
Similarly, misaligned tools or excessive force can crack punches and dies, producing poor-quality parts (burrs, tearing, or chipping of tools). Inconsistent or excessive force application (from poor calibration or sensor error) also degrades part precision. Even failed or misaligned sensors can give bad feedback, causing timing errors or undetected faults.
These issues translate directly into costly downtime and scrap: unplanned press outages can mean weeks of lost production, just-in-time penalties, and high maintenance costs.
The Sensor Data Map (SDM) Software
To tackle these challenges, we developed Sensor Data Map (SDM). SDM connects to all installed press-machine sensors (force/pressure gauges, alignment sensors, temperature probes, etc., from makers like Riken, Keyence, Kyowa) across multiple channels.
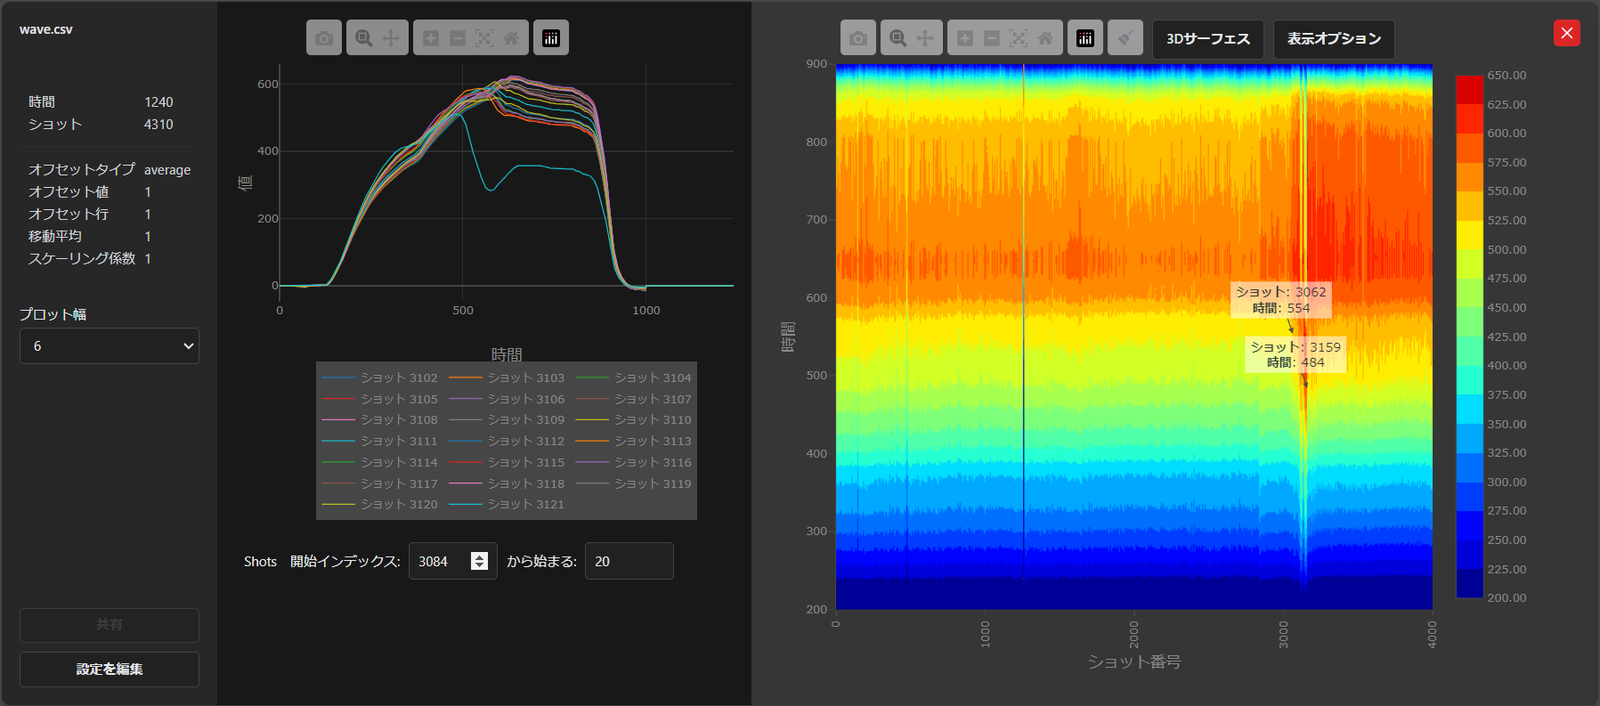
It streams the data in real time during each press stroke, and it can also import historical shot data. SDM then generates intuitive visualizations: a 2D heatmap and a 3D surface map for each press cycle, covering all channels at once. In a heatmap, sensor values are color-coded on a grid (making hotspots obvious), while the 3D plot shows variations in sensor readings as a colored surface (see example below).
These graphical maps let engineers spot patterns or outliers at a glance. As one visualization expert notes, heatmaps “make it easy to visualize sensor value concentrations in a color-coded overview, spotting trends straight away”. By viewing every channel together, SDM helps highlight problems like uneven force distribution or local overheating that single-sensor gauges alone might miss.
- Real-Time, Multi-Channel Data: SDM polls dozens of sensor channels simultaneously on each stroke. It captures pressures, temperatures, alignments, vibrations, etc., from across the press.
- 2D and 3D Plots: For each shot (press cycle), SDM plots one color-coded 3D Heatmap (e.g. shot vs. time and sensor value on the Z-axis) also a 2D graph to visualize the data of every shot in details.
- One-Shot and Continuous Modes: Engineers can examine a single collection of shots post-run, or run SDM continuously for live monitoring. This flexibility means SDM can both analyze archived data and detect anomalies as they happen.
- Correlation Across Sensors: By aggregating multiple channels, SDM lets users correlate signals. For instance, a temperature rise in one part of the press alongside a drop in force might indicate a tool slippage – patterns that simple thresholds on individual sensors would not reveal.
Benefits and Future Directions
This novel visualization approach aims to jump-start predictive maintenance. By mapping thousands of press cycles, we can begin to link visual patterns with specific faults.
Overtime as user collects more and more data, they can understand the pattern of the defect. In future updates of SDM, these patterns can be used to set automated alerts and warn operators before parts are ruined or machines break.
At present, SDM focuses on rich visualization. We consciously invite users to explore the graphs for insights, since this multi-dimensional analysis is new in the industry.
At ADD.Q, we specialize in deploying pressure sensors and analyzing data patterns. In collaboration with Eii Tech Solutions, a web solutions company, we developed SDM software. ADD.Q provides guidance on optimal sensor placement to effectively capture relevant signals and assists in interpreting initial datasets. Together, we aim to make the SDM program's algorithm by adding rules to identify anomalies. By incorporating data from various machines and manufacturers, we will enhance accuracy.
In summary, SDM provides a real-time, multi-channel view of press operations, converting raw sensor streams into easy-to-interpret color maps. It addresses key press problems (misalignment, uneven load, tool wear, etc.) by making subtle anomalies visible.
Over time this should translate into fewer defects and less unplanned downtime. Looking ahead, we welcome feedback on which press issues matter most in your plant: are there specific fault types or industry scenarios you want us to focus on? With more targeted data, SDM will evolve from a visualization tool into a full-featured diagnostic aid.
Would you like a free demonstration of your press machines? Feel free to contact-us.